Newly published CDC data shows that coronavirus is NOT as deadly as we originally thought; Survival rate for adults is 99.98%, fatality rate is 0.007%

With now nine months into the COVID-19 pandemic, there are still debates about how deadly the virus is. Many countries in Europe still considering another round of lockdowns, but the U.S. has so far rejected the idea of a nationwide shutdown. So far, the virus claimed almost one million lives around the world.
The questions many are still asking are: Just how deadly is the coronavirus? Who are the most vulnerable and why? To answer some of these questions, in late August, the U.S. Centers for Disease Control and Prevention (CDC) published its findings of the survival rates for COVID-19 and its controversial provisional death counts. According to the CDC stats, 94% of all coronavirus deaths, on average, have 2 or more pre-existing conditions or causes per death or co-morbidities.
Based on the stats, it means that less than 10,000 Americans, or 6% of the 161,392 US deaths are related to COVID-19 only. Put another way, 94% of Americans who died from COVID-19 had other “types of health conditions and contributing causes” in addition to the virus, the CDC said in the updated report.
That was then. Last week, the CDC released data on new survival rates for COVID-19. The data includes five COVID-19 pandemic planning scenarios “that are designed to help inform decisions by public health officials who use mathematical modeling, and by mathematical modelers throughout the federal government.” According to the CDC, each scenario is based on a set of numerical values for biological and epidemiological characteristics of COVID-19 illness, which is caused by the SARS-CoV-2 virus.
The five COVID-19 Pandemic Planning Scenarios also represent a range of possible parameters for COVID-19 in the United States. All parameter values are based on current COVID-19 surveillance data and scientific knowledge. “Scenarios 1 through 4 are based on parameter values that represent the lower and upper bounds of disease severity and viral transmissibility (moderate to very high severity and transmissibility),” the CDC explained. The CDC says that Scenario 5 represents a current best estimate about viral transmission and disease severity in the United States, with the same caveat: the parameter values will change as more data become available.
Below is a quick summary of the CDC COVID-19 Survival Rates.
Age 0-19 — 99.997%
Age 20-49 — 99.98%
Age 50-69 — 99.5%
Age 70+ — 94.6%
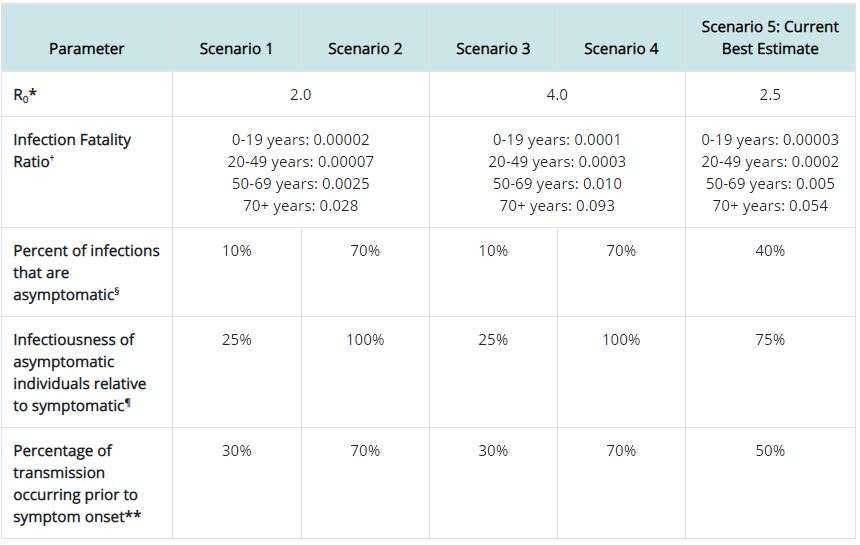
Below is Infection Fatality Ratio for Scenario 5: Current Best Estimate
R0* 2.5
Age 0-19 years: 0.00003
Age 20-49 years: 0.0002
Age 50-69 years: 0.005
Age 70+ years: 0.054
Looking at this data, one can argue that, the most vulnerable age group does (Age 70 and older) does okay with an Infection Fatality Ratio of 0.054. This CDC data should also be sufficient for everyone to feel safe, get the kids back in school, and return back to work. The findings also cast doubts on mainstream media narratives about the potential lockdown later in the year.
Since most in our major news outlets remained silent refuse to cover the news. The state of the media is so bad that it takes a foreign journalist to report the news. Adam Creighton, an Economics Editor, of The Australian and Co-Host of Business Weekend at Sky News Australia, said this on Twitter, “The US govt last week updated the survival rates (i.e., IF infected) for Covid19: …Didn’t see it reported much.”
The US govt last week updated the survival rates (i.e., IF infected) for Covid19:
0-19 99.997%
20-49 99.98%
50-69 99.5%
70+ 94.6%Didn’t see it reported much.https://t.co/miFbqyb9pM
— Adam Creighton (@Adam_Creighton) September 23, 2020
Below is a screenshot of Table 1 of the CDC 5 planning scenarios.
In Table 1 below, the Parameter Values that vary among the five COVID-19 Pandemic Planning Scenarios. The scenarios are intended to advance public health preparedness and planning. They are not predictions or estimates of the expected impact of COVID-19. The parameter values in each scenario will be updated and augmented over time, as we learn more about the epidemiology of COVID-19. Additional parameter values might be added in the future (e.g., population density, household transmission, and/or race and ethnicity).